


Ecommerce valuation multiples in 2026 run from roughly 2.0x to 4.0x SDE for owner-operated stores, 3.0x to 6.0x EBITDA for established brands with management depth, and 6.0x to 10.0x or more for premium, diversified brands. Amazon-only catalogs price at the low end of each band; owned-audience DTC and hybrid omnichannel brands price at the top.
US shoppers spent $340.2 billion online in the second quarter of 2026, 12.2% more than a year earlier and nearly double the growth rate of retail as a whole. Online sales now account for 17.1% of everything sold at retail in the United States, the highest share on record. Every one of those dollars flows through a business somebody owns, and a growing number of those owners are asking the same question we hear every week: how much is my ecommerce business worth?
The honest answer is that it depends on which model you run, how big you are, and how transferable your earnings look to a buyer. A $600,000 Shopify apparel brand, a $3 million Amazon FBA catalog, and a $15 million omnichannel consumer brand are valued on different earnings measures, by different buyers, at different multiples. Most published guides blur those distinctions into a single range. This one pulls them apart.
Below you will find 2026 ecommerce valuation multiples by business model (DTC, Shopify, Amazon FBA, and hybrid), the point at which buyers stop using SDE and start using EBITDA, the specific drivers that add or subtract turns from your multiple, and how ecommerce compares with SaaS, brick-and-mortar retail, and public companies. The benchmarks draw on FE International's experience across more than 1,500 completed transactions, cross-checked against current data from the US Census Bureau, Bain, McKinsey, PwC, PitchBook, and NYU Stern.
If you want the number for your own business rather than a range, you can get a free valuation from our ecommerce team at any point. The rest of this guide explains how that number gets built.
What Are Ecommerce Valuation Multiples and How Do You Calculate Them?
An ecommerce valuation multiple is the number a buyer multiplies your annual earnings by to arrive at a purchase price, and it is the center of every ecommerce business valuation. If your store generates $400,000 of Seller's Discretionary Earnings and a buyer pays 3.5x, the operating business is worth $1.4 million. The multiple is where risk, growth, and transferability get priced; the earnings figure is simply the base it acts on.
The question of how much is my ecommerce business worth resolves into three steps, and every offer you receive will follow the same logic:
- Establish the earnings basis. For most owner-operated ecommerce businesses this is SDE for the trailing twelve months: net profit, plus the owner's salary, plus personal expenses run through the business, plus true one-time costs. Larger businesses with a management team use adjusted EBITDA instead.
- Apply a market multiple. The multiple reflects how comparable businesses have transacted, adjusted for your model, size, growth, margin structure, channel mix, and owner dependency. Owner-operated stores in 2026 typically transact at 2.0x to 4.0x SDE; established brands at 3.0x to 6.0x EBITDA.
- Add inventory and settle working capital. Sellable inventory is valued separately and added to the price at landed cost. Aged or excess stock is usually excluded or discounted.
A worked example makes the mechanics concrete. A Shopify skincare brand nets $310,000. The founder pays herself $70,000, ran $15,000 of personal travel and software through the company, and absorbed a $5,000 one-off legal bill. Her SDE is $400,000. Diversified traffic, a 32% repeat-purchase rate, and a documented supplier bench earn a 3.5x multiple, so the operating business is worth $1.4 million. Add $140,000 of sellable inventory at landed cost and the headline price is $1.54 million.
Why do ecommerce valuation multiples matter?
Multiples matter because they are the shared language of a sale process. A buyer's offer, a lender's underwriting, and a seller's expectations all get translated into a multiple of earnings, which is why a founder who understands the benchmarks negotiates from a position of strength. They also matter long before any sale. On $500,000 of SDE, one additional turn on the multiple is $500,000 of value, and most of the levers that add a turn are operational decisions an owner controls 12 to 24 months ahead of going to market.
Best practices for an accurate ecommerce business valuation
Getting the number right starts with the inputs. Use trailing-twelve-month figures, not a projection. Rebuild the P&L on an accrual basis so cost of goods, inventory purchases, and ad spend land in the periods they belong to. Reconcile revenue to payout reports from Shopify, Amazon Seller Central, and your payment processors, because that is exactly what a buyer's diligence team will do. Keep add-backs conservative: buyers accept owner salary, genuinely personal expenses, and true one-offs, and they reject recurring costs disguised as non-recurring. Break revenue and contribution margin down by channel and by SKU. Then benchmark against your own business model rather than a blended "ecommerce" average, because the spread between models is often wider than the spread within them. Our ecommerce due diligence checklist covers what buyers verify line by line.
An ecommerce business is worth a multiple of its provable trailing-twelve-month earnings, plus inventory at landed cost. The multiple prices risk; the earnings figure is only the base.
What Are Average Ecommerce Valuation Multiples in 2026?
Across FE International's ecommerce transaction data, smaller owner-operated brands typically transact at 2.0x to 4.0x SDE, established businesses at 3.0x to 6.0x EBITDA, and premium diversified brands at 6.0x to 10.0x or more. Businesses that score well on transferability, sustainability, and scalability consistently land in the 4.0x to 6.0x band, and omnichannel operators earn a further 15% to 25% premium over pure-play online peers.
If you want a single "average" figure, use the middle of the band that matches your size. A typical founder-run store with clean books and a reasonable channel mix lands near 3.0x SDE. An established brand with a team, two or more proven channels, and stable margins lands near 4.5x to 5.0x EBITDA. Ecommerce EBITDA multiples above 6.0x require a buyer who sees strategic value: a category-leading product, a subscription layer, or a customer base an acquirer can cross-sell into.
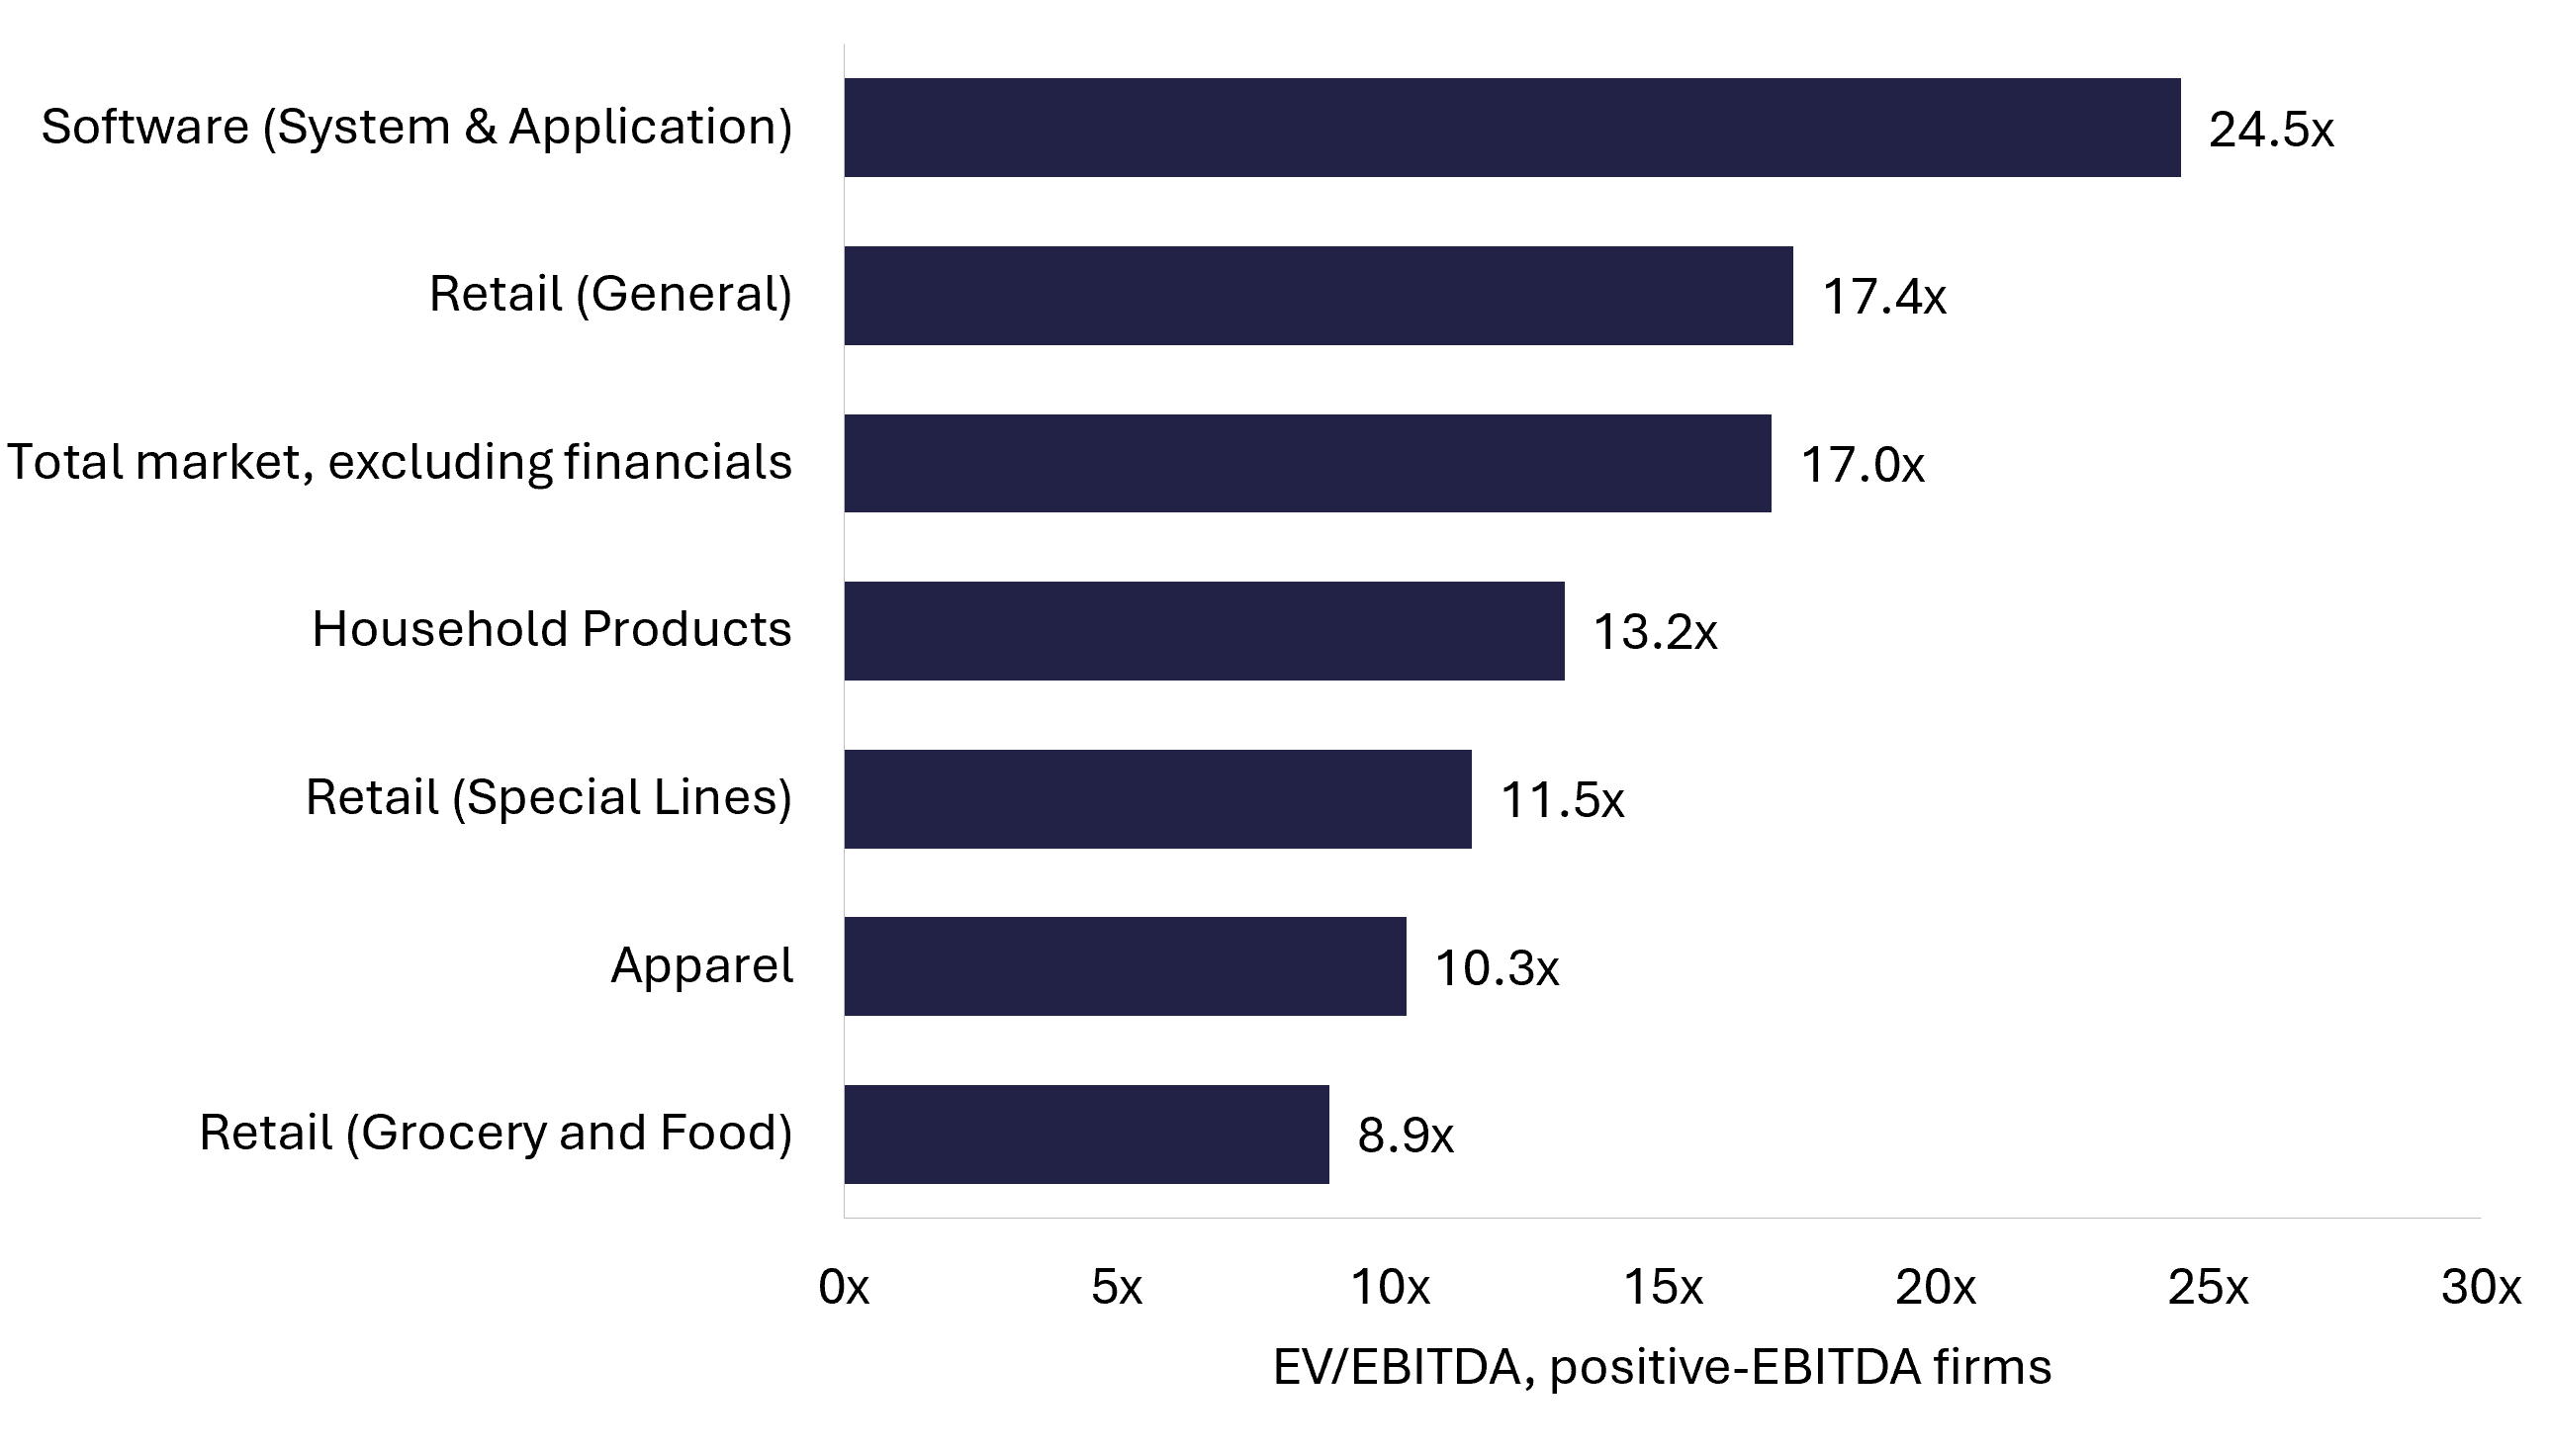
The ceiling is set by the public markets. Public specialty retailers trade at about 11.5x EBITDA, household products companies at 13.2x, and general retailers at 17.4x in the January 2026 NYU Stern dataset. Private businesses trade at a discount to those figures for liquidity and scale reasons, but the direction is instructive: the closer your brand looks to a scaled, professionally managed consumer company, the closer your multiple trends toward the public comps.
Ecommerce valuation multiples for small businesses
For stores generating under $1 million in SDE, the market is deep and well financed. The buyer pool is dominated by individual acquirers using SBA 7(a) loans, which reached a record 77,600 loans and $37 billion in fiscal 2025, alongside search funds and small consumer holding companies. These buyers underwrite conservatively and pay 2.0x to 3.0x SDE for a typical business, stretching toward 4.0x for a store with three or more years of steady growth, low owner hours, and an owned customer list. Businesses under twelve months old rarely clear a lender's underwriting at all, so trading history is the first gate to a strong multiple.
Most ecommerce businesses transact between 2.0x and 6.0x earnings in 2026. Model, size, and preparation decide where inside that range you land.
SDE vs EBITDA: Where Does the Cutover Happen by Business Size?
Seller's Discretionary Earnings measures the total financial benefit available to one owner-operator: net income, plus the owner's compensation, plus personal expenses and true one-time costs added back. EBITDA measures earnings before interest, taxes, depreciation, and amortization, and it keeps management compensation in as a real operating cost because the buyer assumes professionals will run the business. Same business, two lenses: SDE answers what an owner takes home, EBITDA answers what the operation earns.
The cutover follows business size, and in our experience it tracks three thresholds:
- Under roughly $5 million in value: SDE, almost without exception. Buyers at this size are individuals or small groups who will run the business themselves, and lenders underwrite to the cash flow available to that owner.
- $5 million to $10 million: the transition zone. If the founder still does everything, expect an SDE conversation. If a general manager, an operations lead, and a marketing lead run the week, EBITDA applies, and EBITDA-based valuations are usually the higher-value basis because they attract private equity and strategic buyers who pay more turns.
- Above $10 million: EBITDA, applied by buyers who model the business as a standalone company with a full cost structure.
Financing mechanics explain why the line sits where it does. The SBA 7(a) program caps individual loans at $5 million, which anchors the price ceiling for the individual buyer pool that dominates the SDE market. That ceiling has just moved: a rule effective July 4, 2026 lets eligible borrowers combine 7(a) and 504 financing for up to $10 million in SBA-backed funding, and the SBA's administrator has publicly backed lifting the 7(a) cap itself. More financed buyers competing in the $5 million to $10 million zone is good news for sellers sitting in the transition band.
Above that zone, the buyer is usually a private equity platform or a strategic acquirer, and their pricing shows a size premium that SDE-market sellers rarely see. In the first quarter of 2026 the median private equity entry multiple for companies valued at $500 million to $1 billion was 13.2x EBITDA, against 8.5x for companies valued at $25 million to $100 million. Middle-market funds are actively moving down-market in search of value, which is exactly the dynamic that lifts ecommerce EBITDA multiples for brands that cross into that territory with a real team in place.
One practical warning that applies at every size: never apply an EBITDA multiple to an SDE figure. SDE is the larger number because it adds owner compensation back, so pairing it with an EBITDA multiple overstates value and costs you credibility with the first sophisticated buyer who rebuilds the bridge. Build both measures, label them clearly, and present the one that matches your buyer.
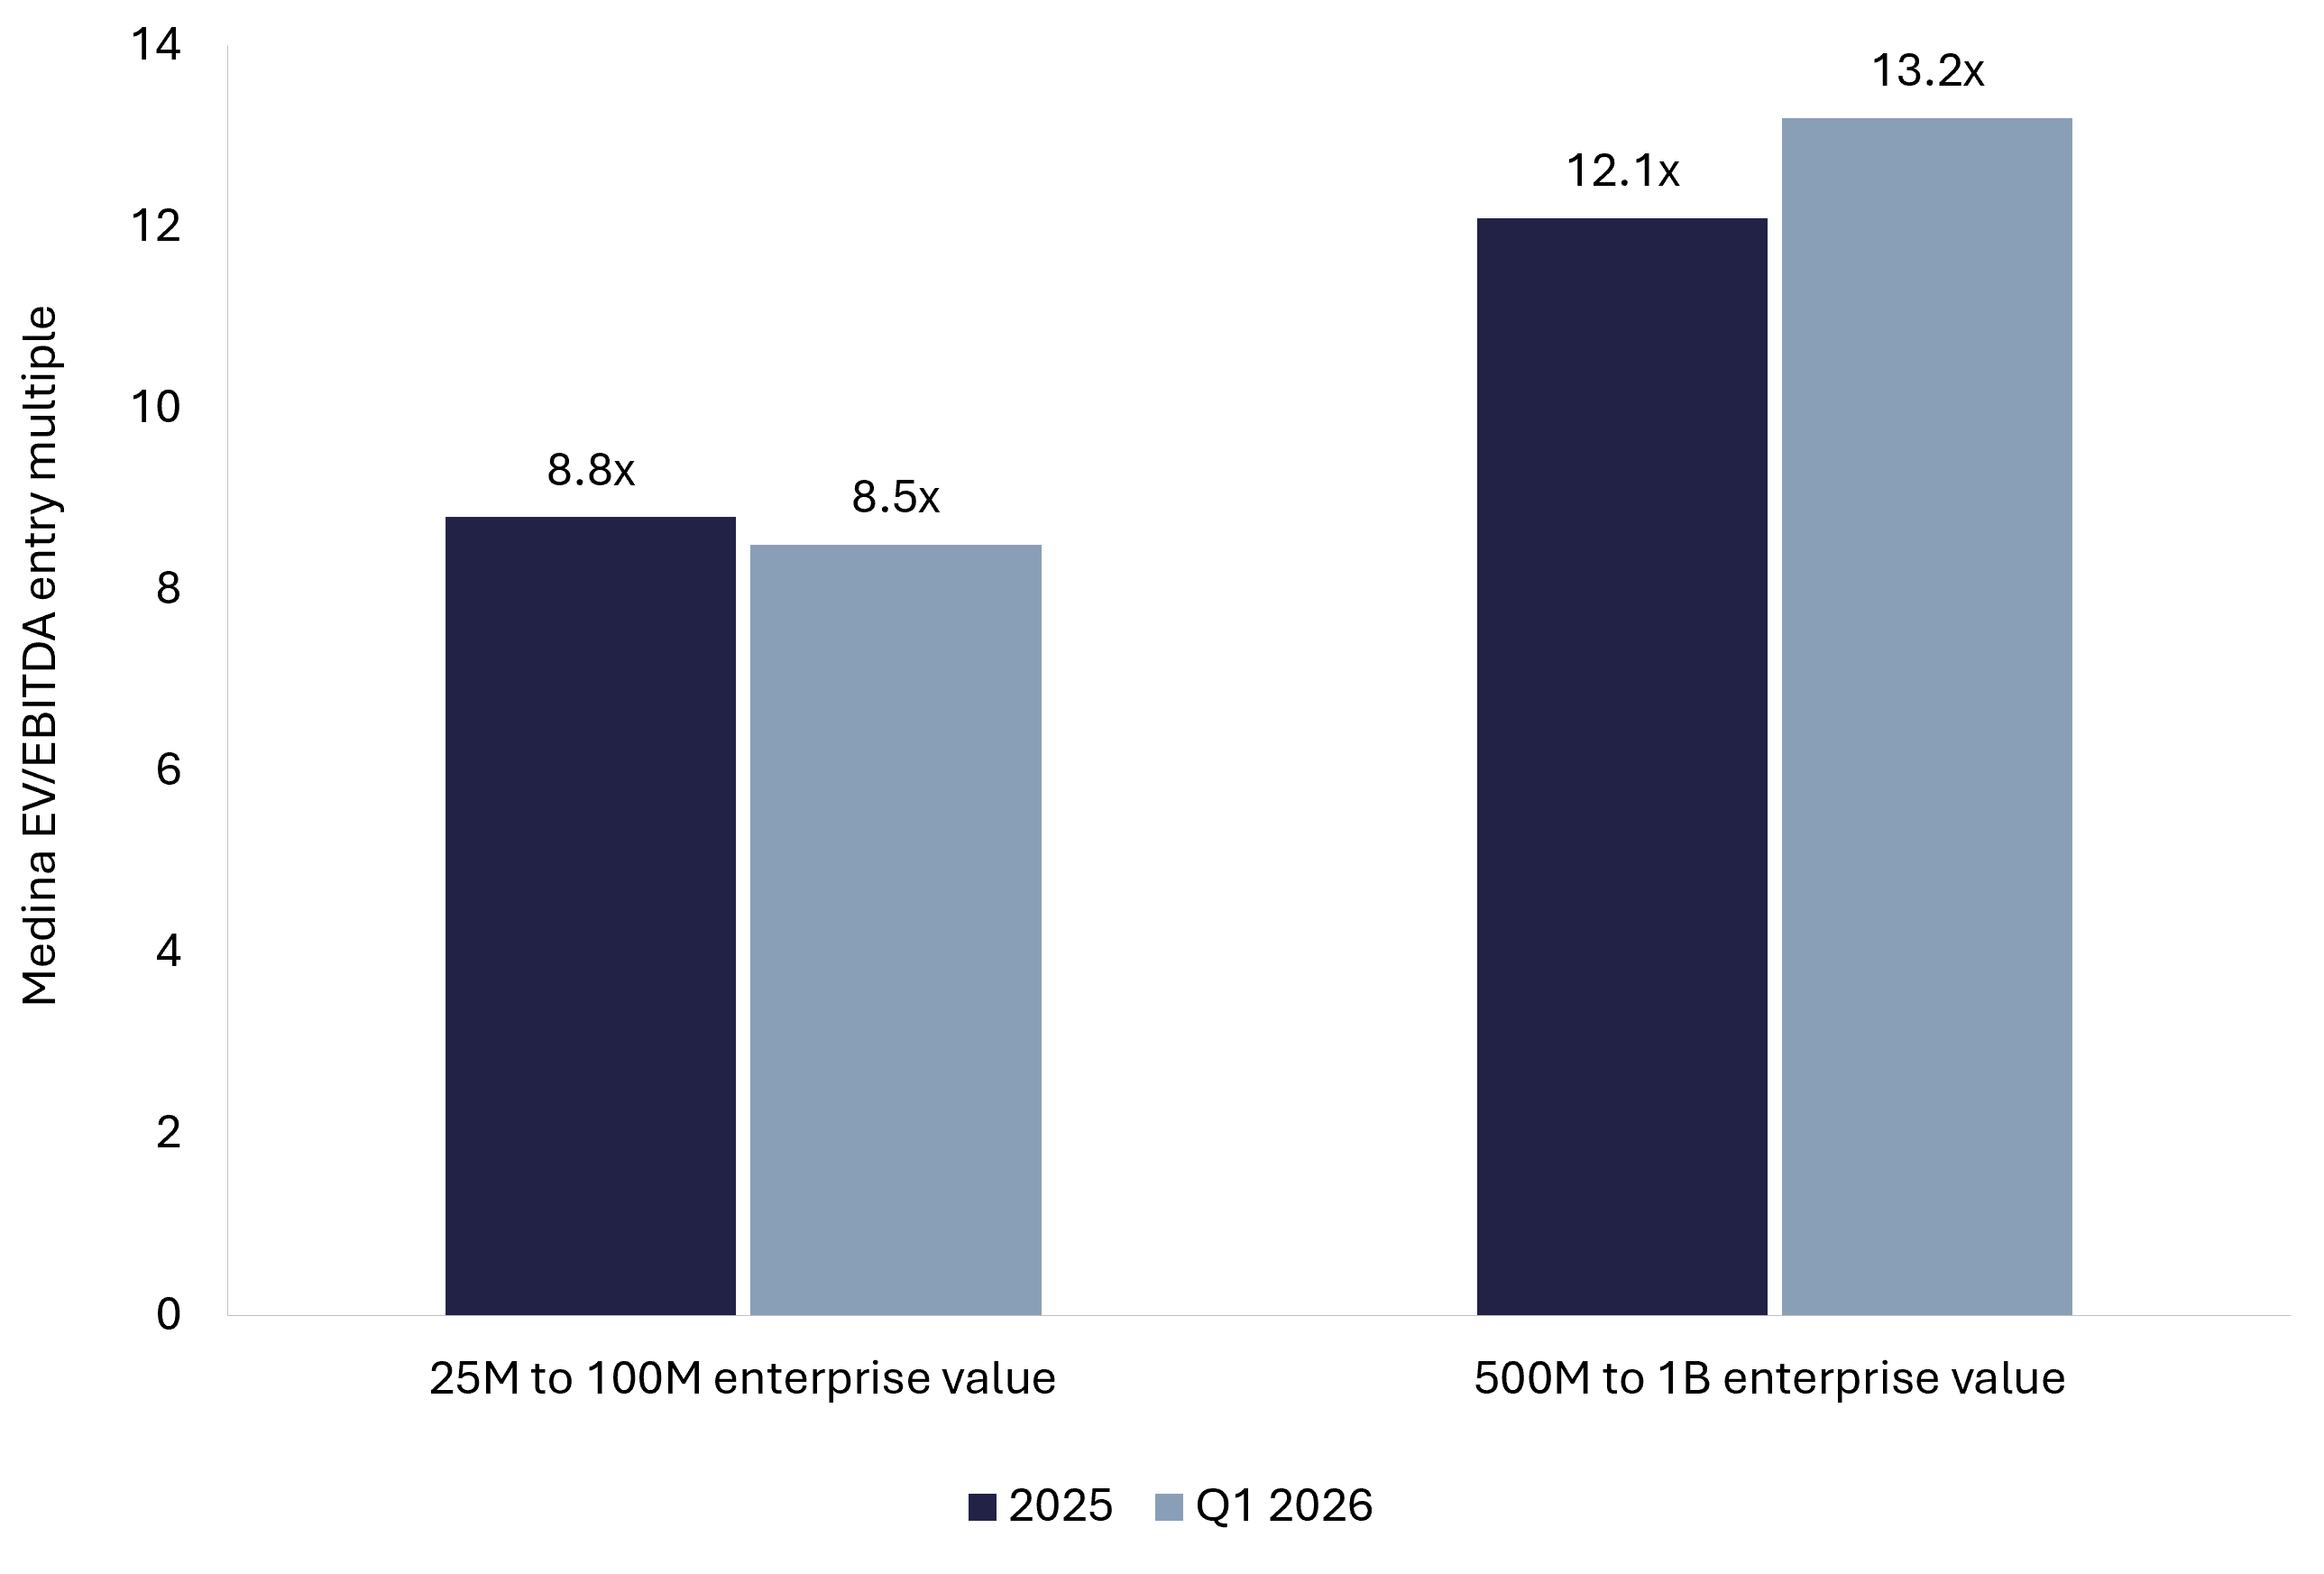
Under $5 million, buyers price SDE. Above $10 million, they price EBITDA. In between, the depth of your team decides the basis, and the basis decides the buyer.
Ecommerce Valuation Multiples by Business Model: DTC, Shopify, Amazon FBA, and Hybrid
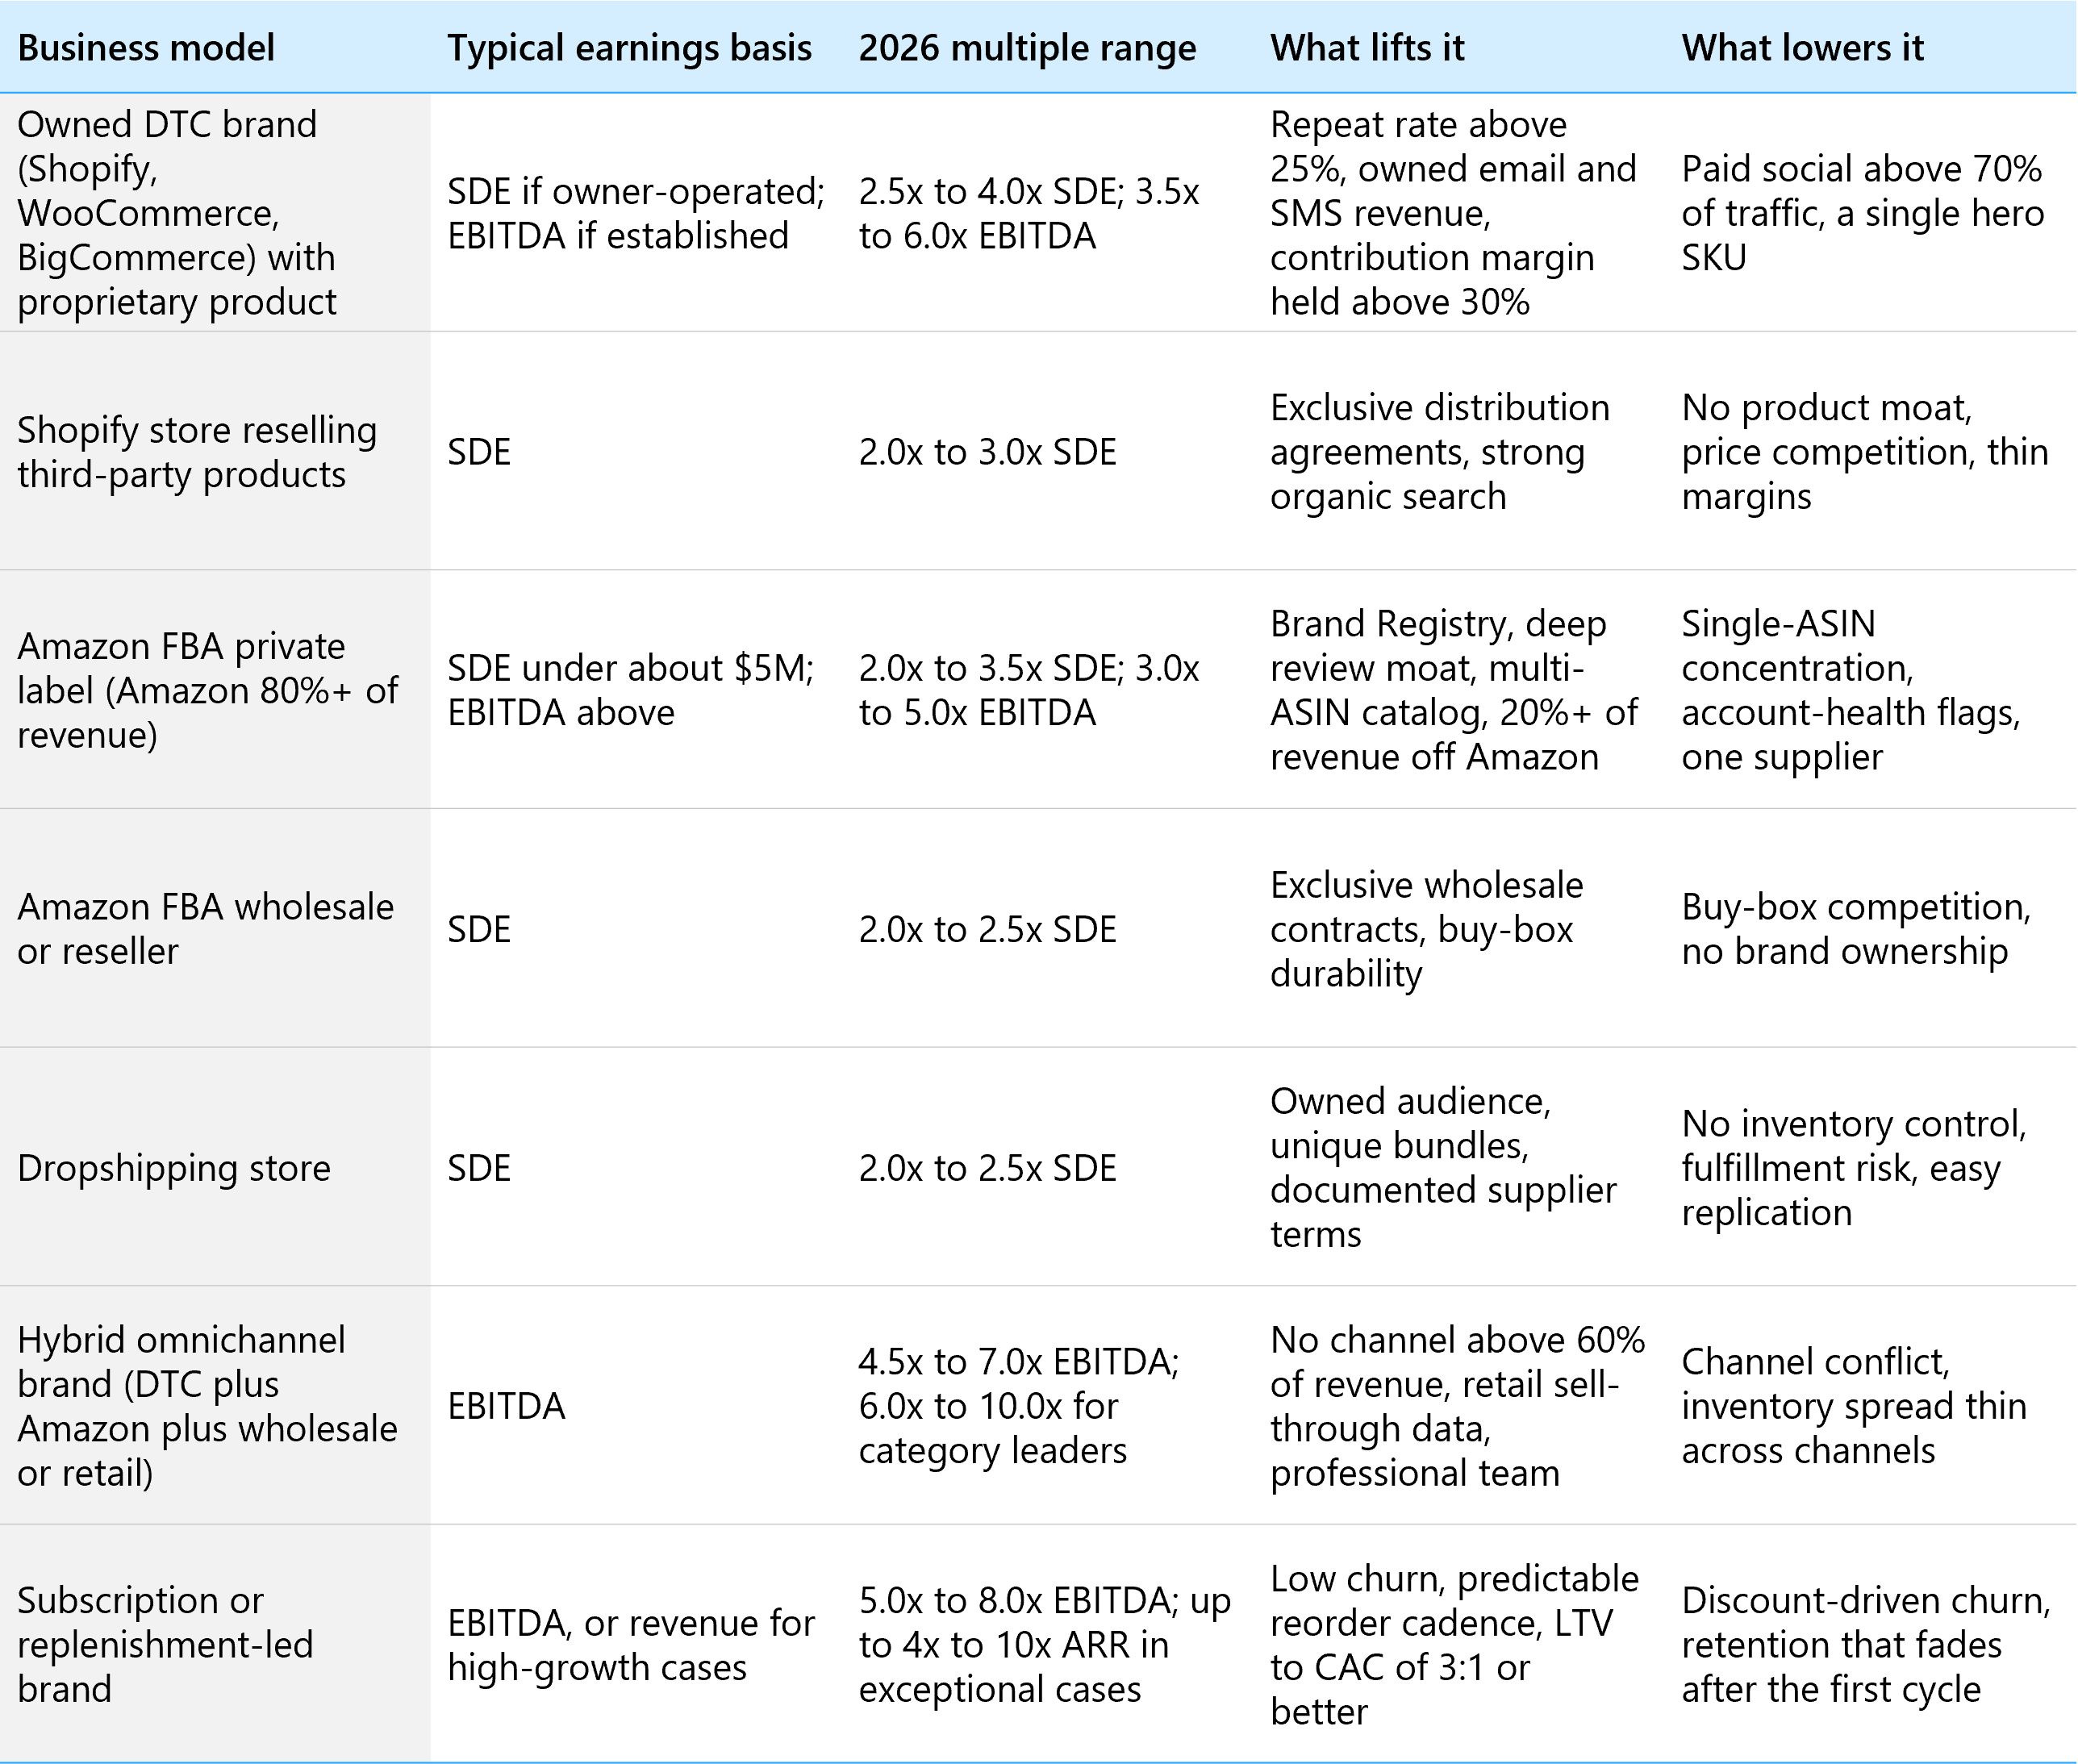
Two ecommerce businesses with identical earnings will not receive identical offers. Business model shifts the band because it changes how transferable and how defensible the earnings are. Demand that is rented from a single platform prices lower than demand a brand owns. The table below summarizes the ranges we see across FE International's ecommerce transactions in 2026. Every range assumes clean, verifiable financials and at least two years of trading history, and the bands overlap on purpose: a well-run business at the top of one row will outprice an underprepared one at the bottom of the next.
How is a DTC or Shopify brand valued in 2026?
DTC brand valuation sits in the middle to upper part of the owner-operated band because the customer relationship transfers with the sale. The metrics that move a Shopify brand's number are cohort retention, contribution margin per order after product cost, fulfillment, processing, and paid acquisition, and the share of revenue from owned channels such as email and SMS. Our dedicated guide to Shopify and DTC brand valuation works through the full metric set with real deal examples. The short version: a brand where 25% to 40% of orders come from returning customers, and where a 3:1 LTV-to-CAC ratio holds across cohorts, prices a full turn above a one-and-done catalog at the same earnings.
How is an Amazon FBA business valued in 2026?
Amazon FBA brands are valued on the same SDE mechanics, with inventory added at cost, but the multiple carries a platform-dependency adjustment. The channel itself is enormous and still growing: third-party sellers accounted for 61% of the units Amazon sold in the second quarter of 2026, and Amazon's third-party seller services revenue grew 16% to $46.8 billion. Buyers like that scale. What they price is concentration. A brand earning 100% of revenue on one platform is exposed to fee, policy, and ranking changes it does not control, so pure-play FBA catalogs sit at the low end of the band. A brand with 20% or more of revenue off Amazon, Brand Registry in place, a multi-ASIN catalog, and clean account health moves into the upper half. Our guide on how to sell an Amazon FBA business covers the transfer mechanics specific to Seller Central accounts and listings.
How is a hybrid omnichannel brand valued?
Hybrid brands earn the highest private-market multiples in ecommerce because they have already proven the channel diversification every buyer wants to underwrite. A brand with 40% DTC, 30% Amazon, and 30% wholesale or retail has three independent demand engines, and losing any one of them does not break the business. That is why omnichannel operators earn a 15% to 25% premium over pure-play online peers, and why strategic acquirers reserve their strongest bids for brands with retail sell-through data. The trade-off is operational. Buyers will test whether inventory, pricing, and marketing are managed coherently across channels, so a hybrid brand needs channel-level P&Ls to prove the model works.
How are subscription and replenishment models valued?
Subscription and replenishment revenue is the closest thing ecommerce has to software economics. A predictable reorder cadence, measurable churn, and rising lifetime value per customer let buyers model future cash flow with confidence, and confidence is what multiples pay for. Brands with a meaningful subscription layer and low churn transact at the top of the EBITDA band, and in exceptional cases replenishment models with low churn have priced at 4x to 10x annual recurring revenue, similar to software. Treat those revenue-based outcomes as the ceiling rather than the baseline. In the lower middle market, cash flow closes deals.
What about ecommerce startups and pre-profit brands?
Early-stage brands are valued differently because there is no earnings base to multiply. Buyers and investors use revenue multiples adjusted for growth, gross margin, and repeat behavior, and the pool of acquirers willing to underwrite a business without profit is thinner and more specialized. Two practical points for founders under two years in: most lenders and individual buyers need at least twelve months of trading history, and a brand that reaches consistent profitability before it goes to market almost always earns more than one that sells on growth alone. If you are building toward an exit, the data room you assemble now, with cohort retention and contribution margin by SKU, is the same one a buyer will ask for later.
Three brands, the same earnings, three different prices
Consider three businesses that each generate $500,000 of SDE. The first sells one hero product on Amazon with 95% of revenue from that channel; at 2.5x it is worth $1.25 million. The second is an owned Shopify brand with a 30% repeat rate, an email list driving 20% of revenue, and a documented supplier bench; at 3.4x it is worth $1.7 million. The third sells through its own site, Amazon, and 400 retail doors, with a general manager running operations. Priced on roughly $380,000 of EBITDA after that manager's salary, at 5.5x with an omnichannel premium, it clears $2 million. Same earnings. A spread of more than $750,000, before inventory. The spread is the model.
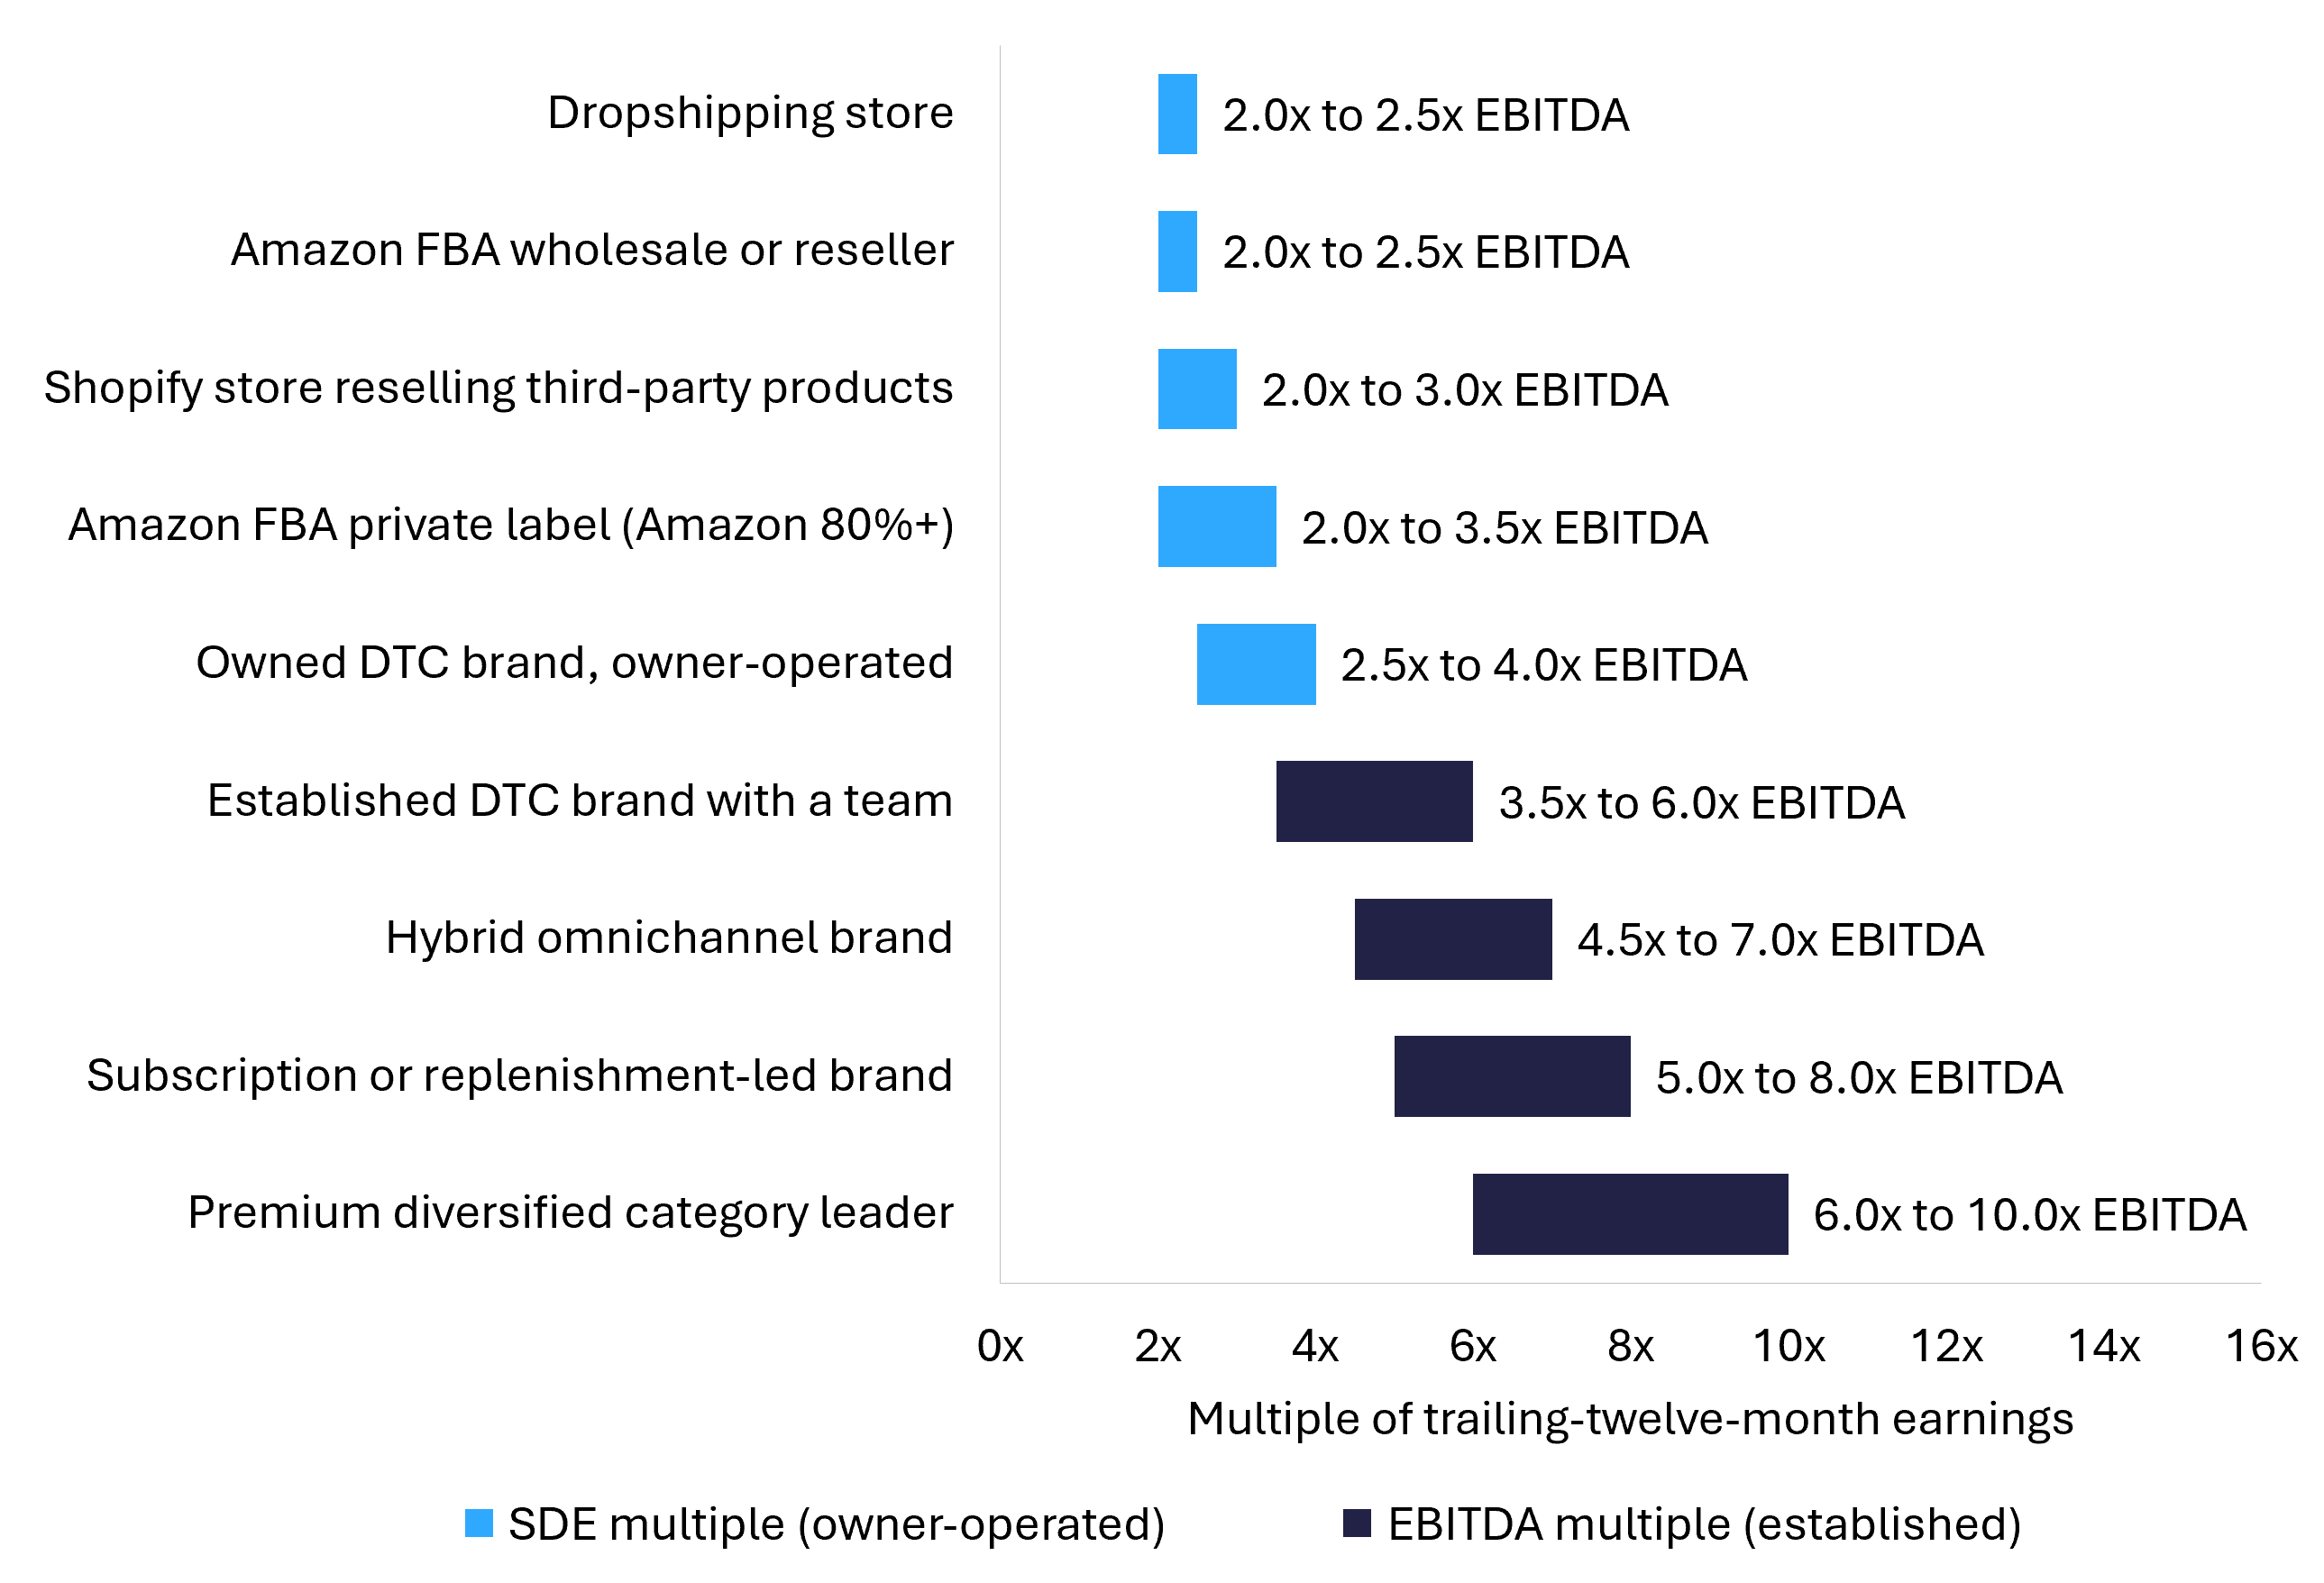
Amazon-only catalogs sit at the bottom of the 2026 range, owned DTC brands in the middle, and hybrid omnichannel brands at the top. Model alone can move a multiple by a full turn at identical earnings.
What Factors Move an Ecommerce Valuation Multiple Up or Down?
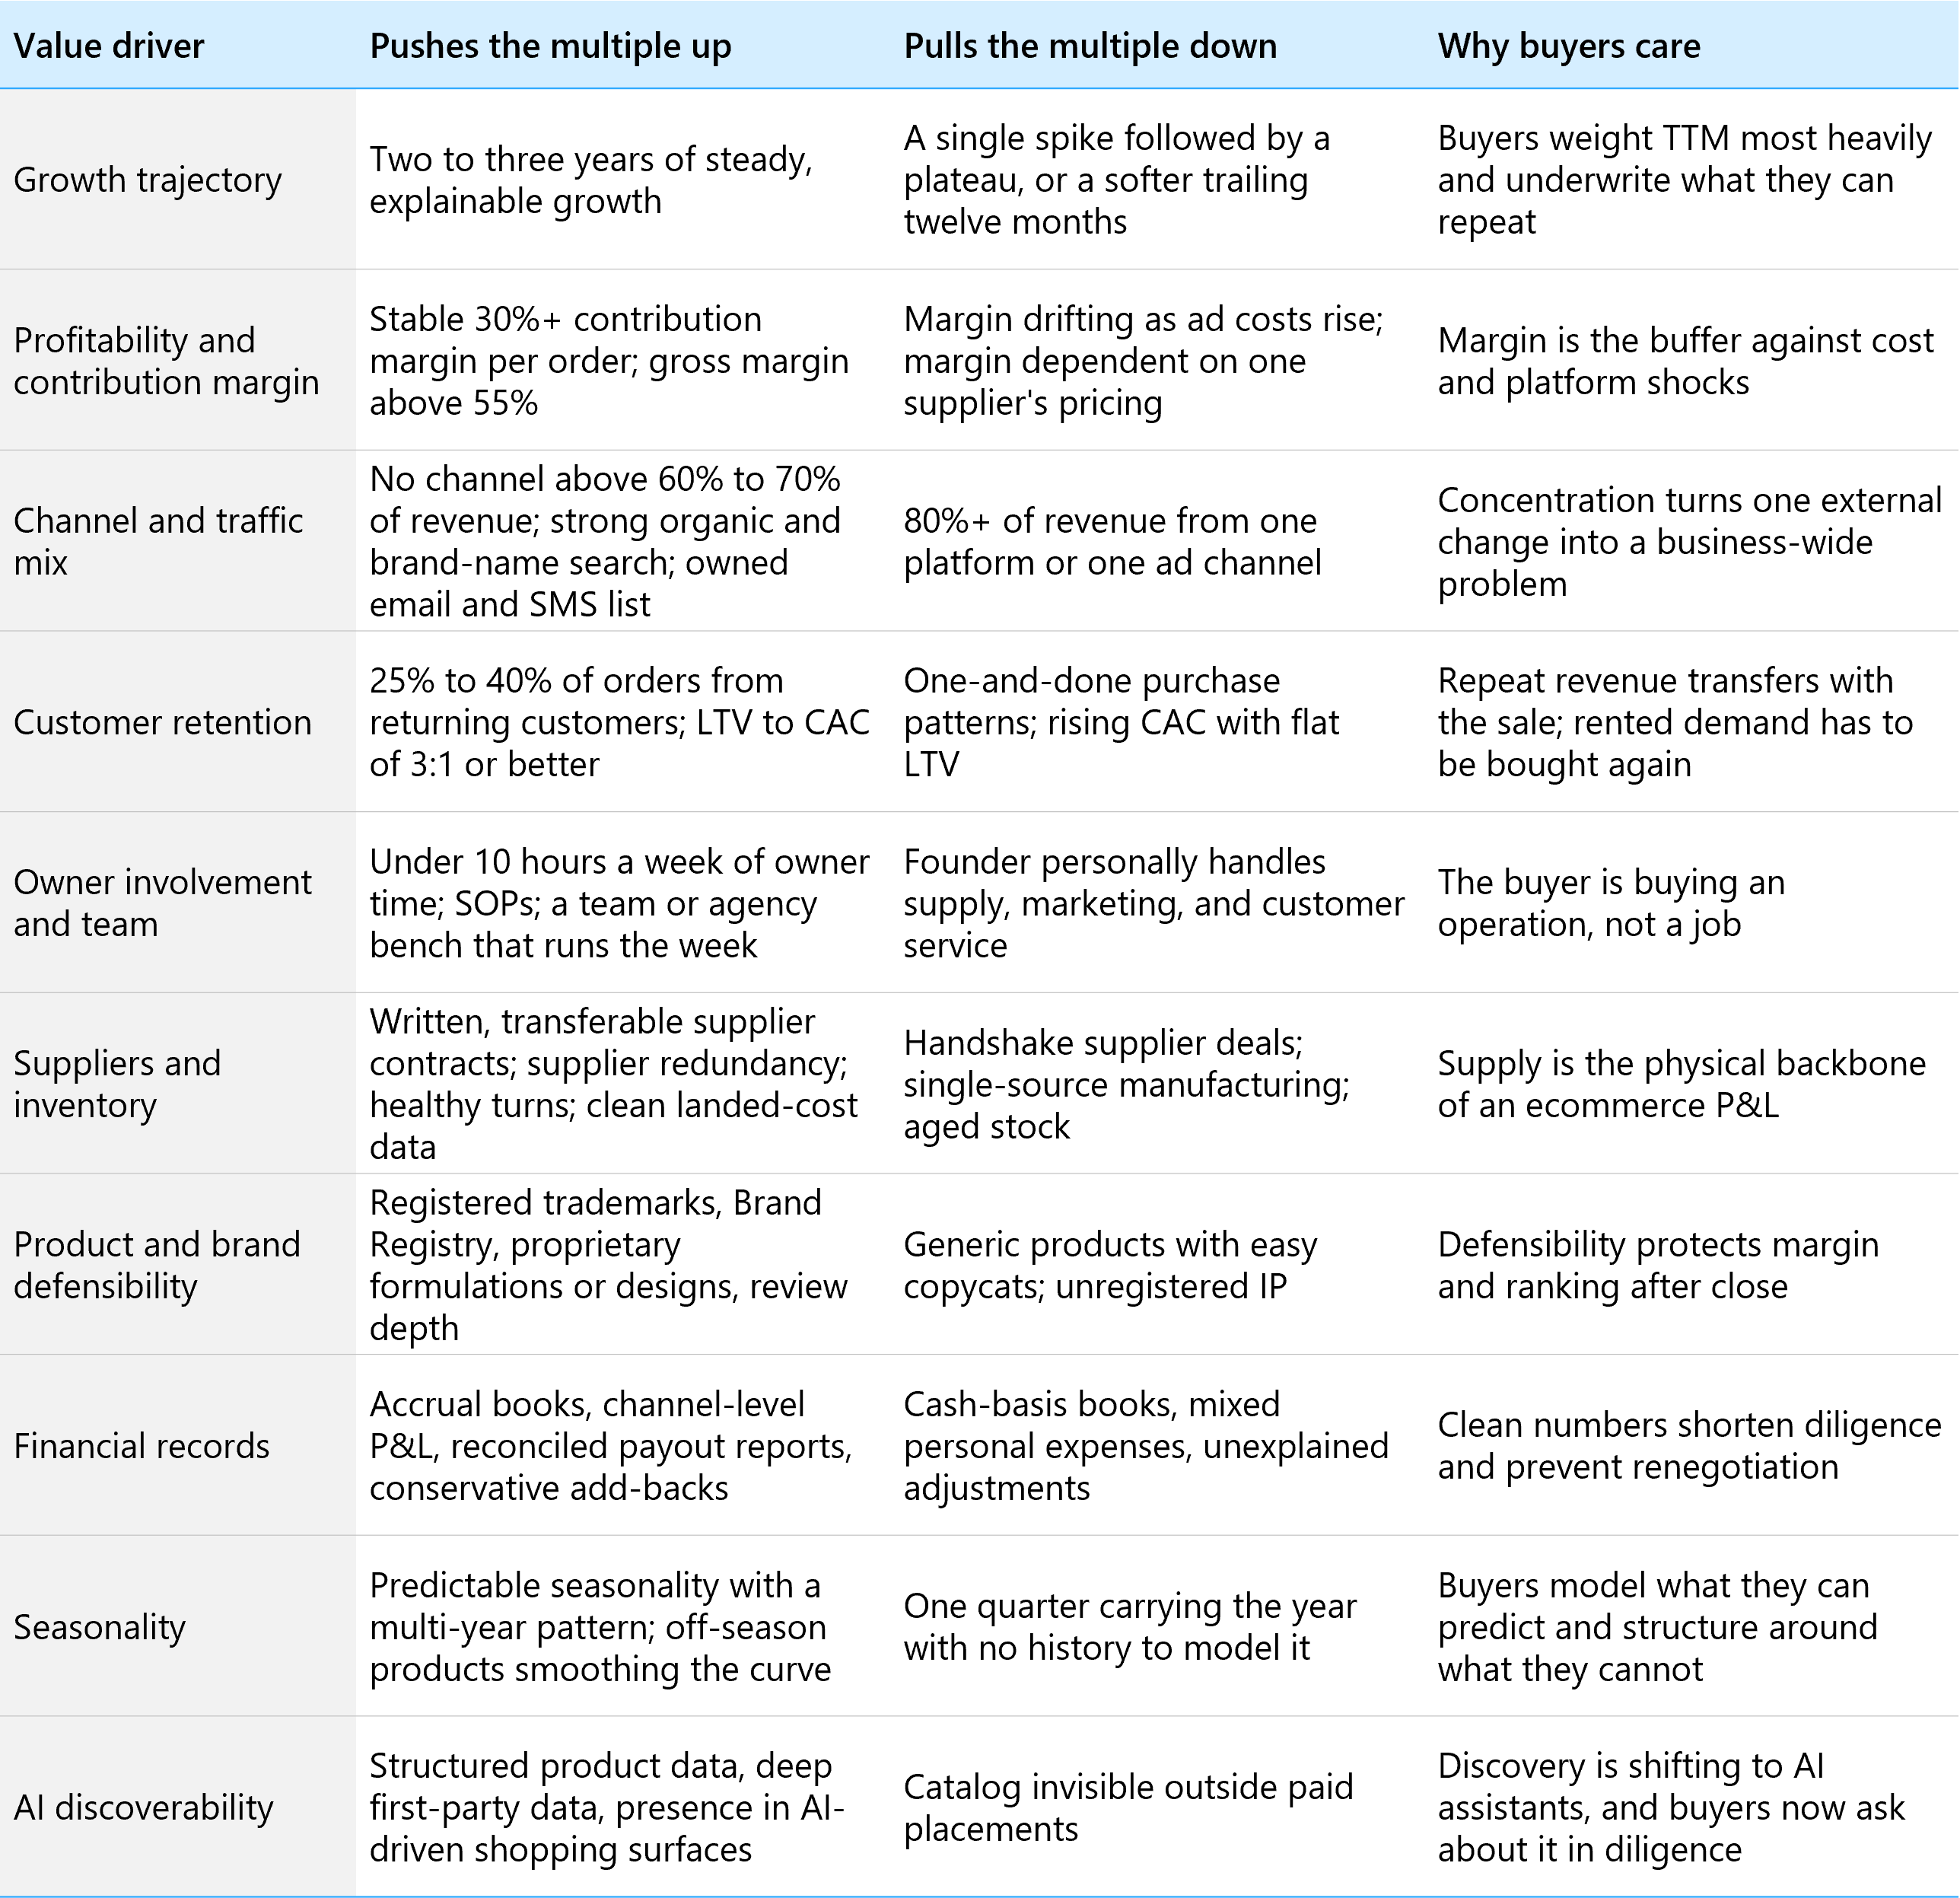
Buyers do not pay for revenue. They pay for confidence that the earnings will still be there in year three under new ownership. At FE International the multiple comes from a proprietary framework refined across thousands of data points, scoring each business on three families of drivers: transferability (how cleanly the earnings move to a new owner), sustainability (how defensible they are against competition and channel shifts), and scalability (how much headroom a buyer can underwrite). Every metric a diligence team asks about rolls up into one of those three questions.
How does revenue growth affect ecommerce valuation multiples?
Growth adds turns when it is durable and explainable, and it adds nothing when it is a spike. Two to three years of steady growth is the simplest signal a buyer can underwrite, and it prices better than a jump-and-plateau pattern at the same revenue. Strategic acquirers are the buyers most willing to pay for growth, and they are actively hunting for it: 113 insurgent consumer brands captured about 36% of growth across tracked consumer categories in 2025 while holding less than 2% of market share, which is why large consumer companies keep buying their way into growth rather than building it. A brand that shows the same pattern in miniature, outgrowing its category on a repeatable engine, is the brand that gets a strategic bid.
How does profitability affect the multiple?
Profitability is the base the multiple acts on, and margin quality is a driver in its own right. Modern buyers rebuild contribution margin per SKU per channel across 24 months, and a brand holding a steady 30% contribution margin outprices one drifting from 35% down to 28% even at identical revenue. The operating backdrop rewards discipline here. Ninety-five percent of retail executives expect global trade policies to push costs higher, and 71% report a competitive edge from stronger cost control. A brand that protected its margin through the tariff adjustments of 2025 and 2026 has already proved the resilience buyers want to see, and it should show that history prominently in its data room.
Do Amazon-only brands get lower multiples?
Yes, at the same earnings, and the gap can run a full turn or more. The discount is not a judgment on Amazon as a channel; it is a judgment on concentration. When one channel or platform carries more than 70% of revenue, buyers price the possibility of a policy, fee, or ranking change they cannot control. The constructive response is diversification, and it does not require leaving Amazon. Adding an owned site that captures 15% to 20% of revenue, building an email list from package inserts and brand-site traffic, and opening a second selling platform changes how a buyer models risk. Our ecommerce M&A trends report tracks how the Amazon aggregator market consolidated and what today's buyers underwrite instead.
AI discoverability: the newest driver on the diligence checklist
Discovery is moving. Twenty-eight percent of Gen Z consumers already use generative AI tools for shopping, and 60% regularly use the AI overview at the top of search results. Retailers are responding in kind: 67% expect to have AI-driven personalization capabilities within the next year. For a brand owner, the valuation implication is direct. Buyers have started asking how well a catalog surfaces in AI-driven shopping tools: structured product data, depth of first-party data, and early traction in assistant-originated orders. This driver did not exist on diligence checklists two years ago, and brands with early evidence win valuation arguments their competitors cannot yet make.
A buyer prices the confidence that your earnings survive the handover. Every driver in the table is a proxy for that confidence.
How Do Market Trends Shape Ecommerce Valuations in 2026?
Two forces set the backdrop for every ecommerce valuation this year: demand for the product category, and appetite among buyers for the businesses that serve it. Both are working in sellers' favor.
On the demand side, online retail keeps taking share. Ecommerce accounted for 17.1% of US retail sales in the second quarter of 2026, up from 16.3% a year earlier, with online sales growing 12.2% against 6.7% for retail overall. The platforms independent brands run on are compounding even faster: Shopify's merchants transacted $115.6 billion of gross merchandise volume in the quarter, up 32% year over year, and Shopify's own revenue grew 34% with an 18% free cash flow margin. Buyers price that structural growth into their models, because a brand riding a rising channel is easier to underwrite than one fighting for share in a flat one.

On the deal side, capital is back and it is selective. Global M&A value rose 40% in 2025 to $4.9 trillion, and 80% of M&A executives surveyed expect to sustain or increase deal activity in 2026. Consumer brands are central to that story: deals under $2 billion now represent 38% of US consumer products M&A, up from about 16% over the prior five years, and the average US consumer deal size has moved to roughly $400 million as large acquirers buy insurgent brands to reposition their portfolios. That is the strategic buyer pool reaching further down-market than it ever has. Selectivity is the other half of the picture: megadeals now account for 47% of consumer markets deal value as capital concentrates around must-have assets with resilient demand and stronger customer access. For a founder, that concentration is an opportunity. Buyers are competing hardest for a smaller set of well-prepared businesses, which means a brand that can prove quality with data stands out and commands premium attention.
Ecommerce valuation multiples over the last decade
The arc of the past ten years explains the shape of today's market. Through the late 2010s, ecommerce businesses transacted on steady SDE multiples as online retail's share of US spending climbed from single digits past 11%. The 2020 to 2021 period pulled several years of channel adoption into eighteen months; Amazon aggregators raised billions, bid FBA multiples to record levels, and priced growth as if pandemic rates were permanent. From 2022 onward the market normalized to durable levels. Aggregators consolidated from more than 100 players to 57, and buyers rebuilt their models around contribution margin and channel durability rather than topline growth alone. What emerged in 2025 and 2026 is a healthier market than the peak ever was, with clearer benchmarks, deeper buyer pools at every size, and ecommerce penetration that has climbed from 10.0% of retail in early 2019 to 17.1% today. Multiples for quality businesses are holding firm, and the best-prepared brands are seeing them rise.
Investor interest: who is buying ecommerce businesses in 2026?
Four buyer groups now compete for ecommerce businesses, and each has a different reason to pay. Individual acquirers and search funds, backed by the record $44.8 billion of SBA-guaranteed lending in fiscal 2025 noted above, dominate the sub-$5 million market and value owner-operable businesses with clean books. Private equity platforms and family offices target brands with $2 million or more of EBITDA that they can scale, and middle-market funds are increasingly moving down-market in search of value. Strategic consumer companies pay the highest multiples for brands that fill a portfolio gap, as Bain's insurgent-brand data shows. Experienced operators and micro-holding companies round out the pool. Competitive tension between those groups is what turns a fair price into a strong one, and it is the reason a structured sale process with several buyer types typically beats a single inbound offer. Our guide for acquirers, how to buy an ecommerce business, shows exactly how each buyer type underwrites.
Record ecommerce penetration plus selective, well-capitalized buyers is the best combination a prepared seller can ask for: demand for the category is rising, and competition for quality businesses is real.
How Do Ecommerce Multiples Compare With SaaS, Brick-and-Mortar, and Public Companies?
Founders often benchmark against the wrong comparison set. Ecommerce, software, and physical retail are valued on different economics, and understanding why keeps expectations grounded and negotiations sharp.
Ecommerce valuation multiples vs SaaS and tech multiples
Software earns higher multiples because its revenue recurs and its marginal cost of serving a new customer is close to zero. Private SaaS businesses generally transact between 2x and 7x annual recurring revenue in 2026, and the public markets show the same gap at scale: software companies trade at about 24.5x EBITDA against 11.5x for specialty retailers. Ecommerce businesses carry inventory, fulfillment cost, and paid acquisition, so buyers price them on cash flow rather than revenue. The gap narrows when an ecommerce brand adopts software-like characteristics. A subscription or replenishment layer, high repeat rates, and owned customer data all pull the multiple toward the top of the ecommerce range. The lesson is not to chase a SaaS multiple; it is to build the parts of your business that behave like recurring revenue.
Ecommerce valuation multiples vs brick-and-mortar retail
Compared with physical retail, ecommerce businesses are more transferable and more scalable, and buyers pay for both. There is no lease to assume, no location risk, and no store staff to retain; the assets that transfer are a domain, a customer database, supplier relationships, listings, and inventory. Physical retail carries fixed costs that make small-store earnings harder to move to a new owner, which is why owner-operated stores typically transact at the lower end of SDE ranges. At the public-company level the comparison is more nuanced. In the same January 2026 NYU Stern dataset, grocery retailers trade near 8.9x EBITDA while general retailers trade near 17.4x, because scale and category matter more than channel once a company is large enough. The strongest private valuations now go to brands that combine both worlds, online-native operators with retail distribution, which is why hybrid brands sit at the top of the private range.
Ecommerce valuation multiples for public companies
Public ecommerce and retail companies are valued on forward revenue and EBITDA by liquid markets, and they set the reference points private buyers anchor against. In the January 2026 NYU Stern data charted below, general retailers trade at 17.4x EBITDA, household products companies at 13.2x, specialty retailers at 11.5x, and apparel companies at 10.3x. Platform companies earn more: Shopify's investors value 30%-plus growth and an 18% free cash flow margin at a premium, and our Shopify brand valuation guide compares Shopify's own multiple with Amazon's in detail. The useful takeaway for a private brand owner is directional. Private businesses trade at a discount to public peers for liquidity, scale, and key-person reasons, and every step toward professional management, diversified channels, and predictable cash flow narrows that discount.
Do ecommerce valuation multiples differ by region and in emerging markets?
Yes, and the direction surprises many founders. Public-market retail multiples are higher outside the United States in several categories: specialty retailers trade at about 14.1x EBITDA in Europe and 15.3x in emerging markets against 11.5x in the US, and household products companies at 22.0x in emerging markets against 13.2x in the US, reflecting faster consumption growth in those markets. Private lower-middle-market deals tell a different story. The United States has the deepest pool of financed buyers at every size, which is why US-based brands with clean books and US customer bases command the most competitive processes. For founders elsewhere, or US brands selling internationally, cross-border capability is increasingly a value driver: buyers pay for a brand that already ships and takes payment in several markets, provided logistics and tax exposure are verified in diligence. FE International's buyer network spans 34 countries, which lets a strong brand from any region reach the buyers most likely to pay for it.
Ecommerce multiples sit below software and above owner-operated physical retail. Build the pieces of your brand that behave like recurring revenue, and it moves up the range.
How Can You Improve Your Ecommerce Valuation Multiple Before You Sell?
Multiples reward preparation, and most of the highest-return moves take 12 to 24 months to show up in numbers a buyer will trust. The levers below have the largest effect on price in our experience.
- Clean up the financials. Accrual accounting, channel-level P&L, reconciled payout reports, and conservative, documented add-backs. Every hour spent here removes a diligence discount later.
- Diversify one channel beyond your core. A second proven channel, even at 15% of revenue, changes how a buyer models risk. For an FBA brand that means an owned site; for a DTC brand it means Amazon or wholesale.
- Add a recurring revenue layer. Subscriptions and replenishment programs make cash flow predictable, and predictability is what multiples pay for.
- Grow the owned audience. Email and SMS revenue transfers with the sale; rented reach does not.
- Protect contribution margin. Renegotiate supplier terms, cut unprofitable SKUs, and track margin per order per channel so you can prove it held through cost pressure.
- Reduce owner hours and document everything. SOPs, delegated supplier relationships, and a team that runs the week without you.
- Secure the moat. Trademarks, Brand Registry, supplier redundancy, and structured product data ready for AI-driven discovery.
- Build the data room early. Cohort retention, contribution margin by SKU, and traffic analytics organized before anyone asks. Our exit planning overview for ecommerce sellers lists what to assemble.
A brand that executes even four of these typically moves a full turn on its multiple. On $500,000 of SDE, one turn is $500,000 for work you control entirely.
Timing matters as much as the checklist. Go to market after your strongest season, with trailing-twelve-month figures that include it, and allow several months from preparation to close. If your fundamentals are already strong, the current market rewards acting: buyer demand for well-prepared ecommerce businesses is deep at every size, and a sale process started now lands inside this window. Our guide on how to sell an ecommerce business covers the process end to end, and our ecommerce sell-side team runs it for you.
On $500,000 of SDE, one extra turn on the multiple is $500,000 of value. Preparation is the highest-margin project in ecommerce.
Know Your Number Before You Negotiate
Ecommerce valuation multiples in 2026 reward the businesses that make a buyer's job easy. The ranges are clear: 2.0x to 4.0x SDE for owner-operated stores, 3.0x to 6.0x EBITDA for established brands, and 6.0x to 10.0x or more for premium diversified brands, with model, size, and preparation deciding where inside those bands you land. The market backdrop is constructive on both sides of the table: record ecommerce penetration, strategic acquirers reaching further down-market than ever, and financed buyers competing at every size.
Ranges tell you the neighborhood. In an ecommerce business valuation, your actual number depends on cohort retention, contribution margin, channel mix, owner independence, and a dozen factors a benchmark table cannot see. FE International's ecommerce and consumer products practice has advised on hundreds of ecommerce exits as part of more than 1,500 completed transactions with a 94.1% success rate, and every valuation we produce is built from real deal data rather than published rules of thumb.
Get a free valuation to find out what your DTC, Shopify, Amazon FBA, or hybrid brand is worth today, confidentially and with no obligation. If you are already planning an exit, our ecommerce sell-side advisory team will show you which buyers would compete for your business and what would raise the number before you go to market.